Flagship Project: End-to-End Financial Analytics Suite
An integrated solution for optimization, prediction, and competitive intelligence.
Overview: This project is a comprehensive financial analysis and forecasting suite built for "Valentis Motors," a mock global automotive manufacturer producing both traditional (ICE) and electric (EV) vehicles. The suite provides end-to-end analytical capabilities, from data ingestion and preparation to multi-component forecasting, scenario analysis, and strategic budget optimization.
This portfolio piece demonstrates advanced skills in data engineering, time-series forecasting, financial modeling, and optimization to drive strategic business decisions.
Module 1: Predictive Cash Flow Forecasting & Scenario Analysis
This module is the core of the suite, designed to move beyond basic trend extrapolation to Causal AI Modeling. It predicts Operating Revenue, Cost of Goods Sold (COGS), and Operating Expenses (Opex) by modeling their statistical relationships with external macroeconomic drivers.
Key Methodological Innovations:
- Hybrid Training Strategy (Synthetic + Real Data)
- The Problem: Real-world historical data (2021–Present) was too short to capture long-term economic cycles and lacked the variance needed to train the model on cost sensitivities (e.g., how COGS reacts to high inflation).
- The Solution: Implemented a Synthetic History Generator (
build_synthetic_history.py) that creates 20 years of proxy data (2000–2021) using real-world benchmarks (e.g., US Total Vehicle Sales, CPI). - The "Intellectual" Leap: Instead of random noise, the synthetic generation uses Causal Logic. Synthetic COGS was mathematically derived from the
EV_Component_Cost_Index(CPI proxy). This forced the Prophet model to "learn" a positive correlation between input costs and COGS, correcting a previous flaw where the model incorrectly assumed higher costs improved margins.
- Driver-Based Scenario Modeling (Input vs. Output Manipulation)
- Shift: Moved from "Hardcoded Heuristics" to "Exogenous Shock Modeling."
- Approach: Instead of hardcoding the results (e.g., "Tariff Revenue = 80% of Baseline"), I implemented
generate_tariff_indicators.pyto shock the inputs instead.- Tariff Scenario Definition: A 25% shock to the
EV_Component_Cost_Indexand a 15% drop inConsumer_Confidence_Index.
- Tariff Scenario Definition: A 25% shock to the
- Result: The model endogenously predicts margin compression and revenue suppression based on learned elasticities, providing a scientifically robust "What-If" analysis without manual overrides.
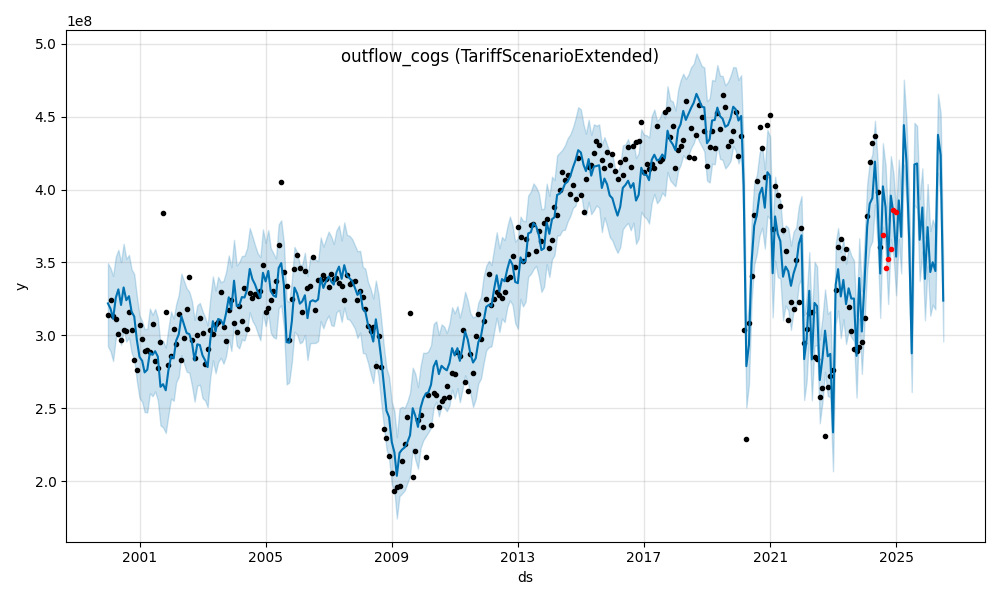
Figure 1: COGS projection under the Tariff Scenario, demonstrating the model's sensitivity to external cost drivers.
- Revenue Sensitivity & Risk Quantification
- Analysis: The model captures the non-linear impact of "Consumer Confidence" and "Cost Indices" on top-line growth, generating the divergence shown in Figure 2.
- Outcome: Provides a dynamic range of potential revenue outcomes, allowing the business to prepare contingency plans for specific "Trigger Levels" in the macro economy.
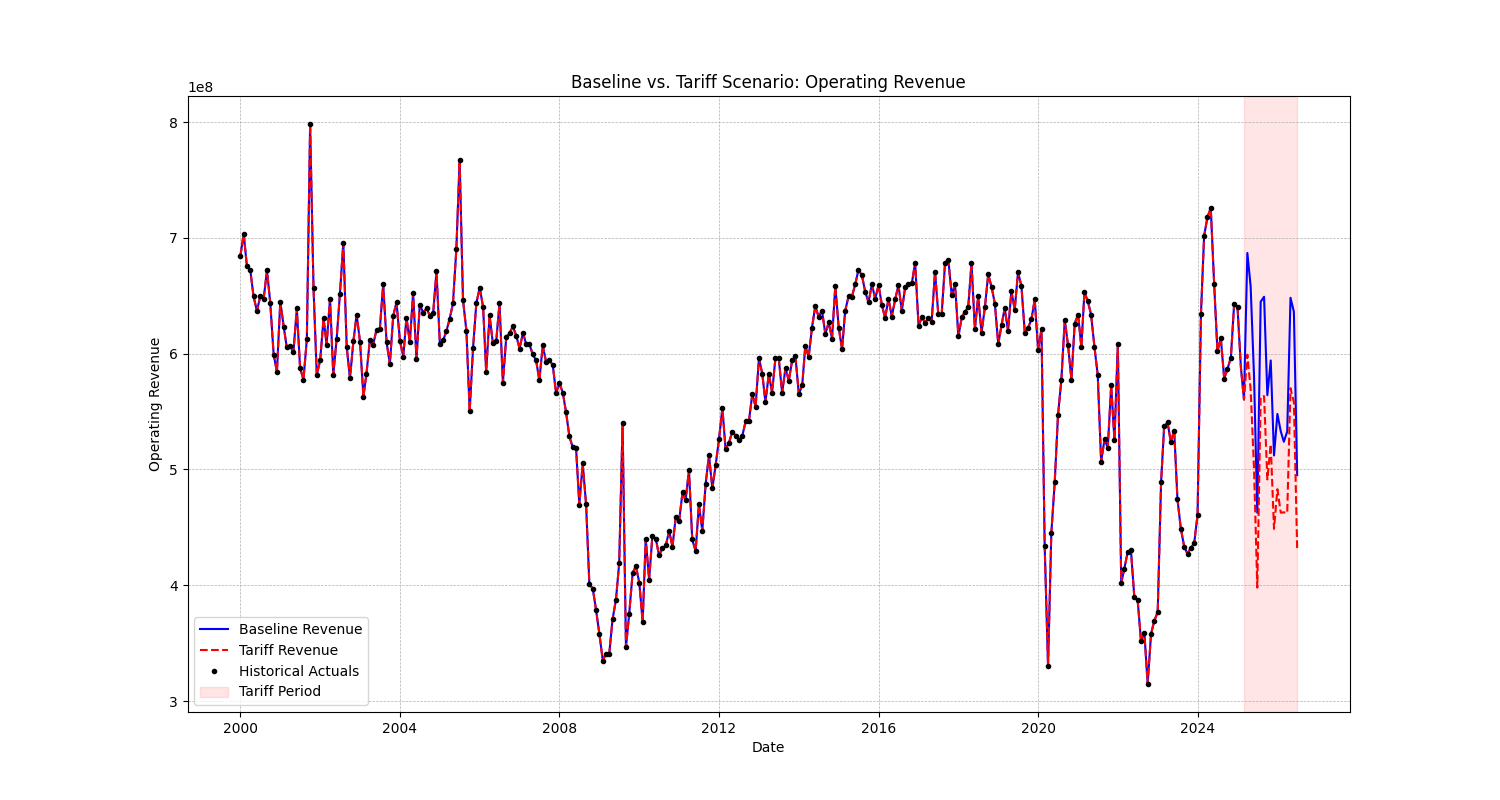
Figure 2: Revenue forecast comparison, highlighting the impact of macroeconomic shocks on top-line growth.
Technical Implementation:
- Model: Facebook Prophet with Multiplicative Seasonality and Regressors.
- Regressors:
Interest_Rate_Proxy(Negative correlation to Revenue validated).Consumer_Confidence_Index(Positive correlation to Revenue validated).EV_Component_Cost_Index(Positive correlation to COGS validated via Synthetic training).
- Validation:
- Method: Blind Backtest (Training on pre-2023 data, testing against 2023–2024 "Truth").
- Performance: Achieved a MAPE (Mean Absolute Percentage Error) of 9.66%, categorized as "High-Fidelity."
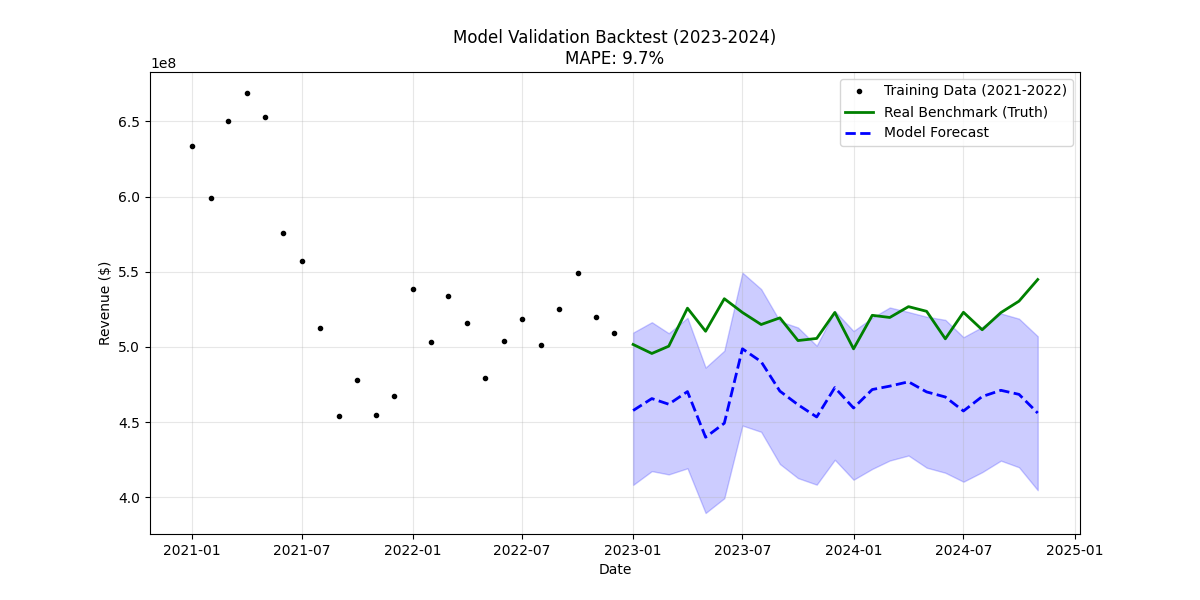
Figure 3: Blind backtest results showing high fidelity tracking of actuals vs. forecast.
Module 2: Intelligent Budget Allocation Optimizer
This module moves beyond reporting to Optimization and Decision Support, demonstrating how human-AI collaboration can solve complex resource allocation problems.
Core Functionality:
- Objective: Maximize a defined strategic objective (e.g., Weighted ROI, Operational Efficiency) subject to strict financial constraints.
- Input Data: Mock departmental budget requests and historical performance metrics (ROI on marketing spend, operational efficiency scores).
- Optimization Model: Built using Python's PuLP library (Linear Programming).
- Decision Variables: Allocation amounts per department.
- Constraints: Total Budget Cap (Baseline vs. Tariff scenarios), Minimum Departmental Funding levels.
- Objective Function: Maximize ∑ (Allocation_i × ROI_i × StrategicWeight_i).
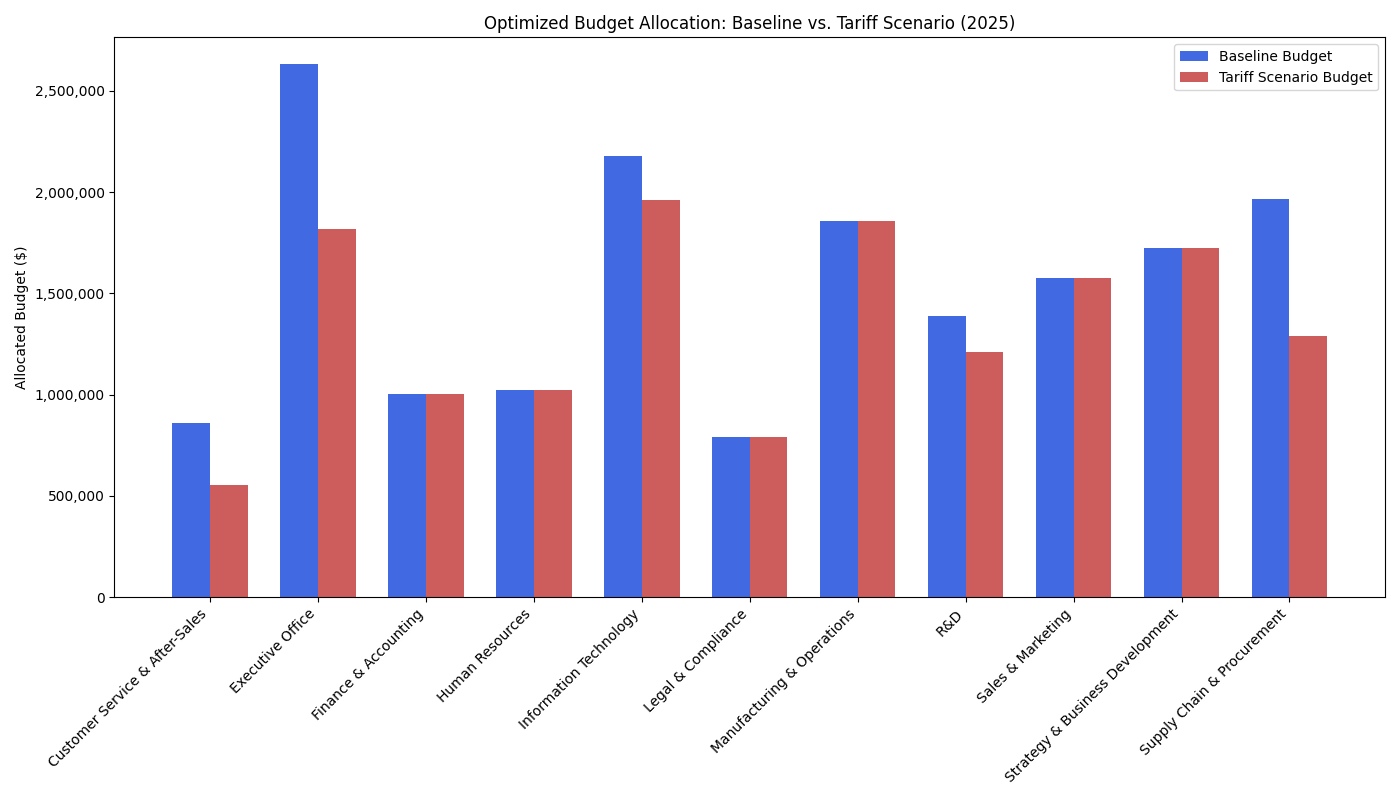
Figure 4: Optimal budget reallocation between Baseline and Tariff scenarios.
Strategic Value:
- Demonstrates higher-level analytical thinking by shifting focus from "Where did the money go?" to "Where should the money go?"
- Provides actionable recommendations for reallocating funds during the Tariff Scenario (e.g., cutting low-ROI areas to preserve R&D).
Module 3: AI-Enhanced Competitor Financial Benchmarking Tool
This module integrates external market intelligence to benchmark Valentis Motors against real-world industry leaders (e.g., Ford, GM, Tesla).
Key Components:
- Automated Data Collection:
- Python scripts scrape or fetch key public financial data (Revenue, Net Income, R&D Spend) for competitor companies.
- Data is stored in the SQL database for structured analysis.
- Financial Ratio Analysis:
- Calculates standardized metrics (Net Profit Margin, R&D % of Revenue, Current Ratio) to allow for apples-to-apples comparisons.
- AI-Driven Qualitative Insights:
- Uses an LLM API to ingest and summarize key findings from competitors' annual reports or news releases.
- Combines quantitative charts (Power BI) with qualitative AI-generated summaries to provide a holistic view of the competitive landscape.
Strategic Value:
- Shows the ability to integrate external unstructured data (text) with structured financial metrics.
- Enables "Peer Group Analysis" to contextualize Valentis Motors' performance against market standards.
(Note: This dataset is a representative sample, anonymized to protect proprietary methods while showcasing the analytical structure.)