Interactive Financial Health Dashboard for an SMB
An easy-to-understand dashboard summarizing key financial KPIs for strategic decision-making.
Project Overview: To create a realistic analytical foundation for this project, I developed a comprehensive financial model for 'ElectraDrive,' a mock Small-to-Medium Business. The dataset integrates the three core financial statements; the Income Statement, Balance Sheet, and Cash Flow Statement to provide a complete and dynamic picture of the company's financial health. This structured model serves as the basis for all KPI calculations and visualizations. The complete dataset is available for download on this page.
The Business Problem: Small and Medium Businesses (SMBs) often lack dedicated analysts, making it difficult to get a clear, comprehensive view of their financial health. Business owners need a simple yet powerful tool to translate complex financial statements into actionable insights for making informed decisions.
My Solution: I created an interactive dashboard specifically designed for the needs of an SMB. I built a realistic mock financial database (P&L, Balance Sheet, Cash Flow) and used SQL to query the necessary data. More complex financial ratios, such as the Current Ratio, Debt-to-Equity, and Cash Conversion Cycle, were calculated using Python (Pandas). The final result is an interactive Power BI dashboard featuring clear visualizations, slicers for date ranges, and drill-downs, allowing any business owner to easily assess their company's performance.
(Note: This dataset is a representative sample, anonymized to protect proprietary methods while showcasing the analytical structure.)
Key Dashboard Pages
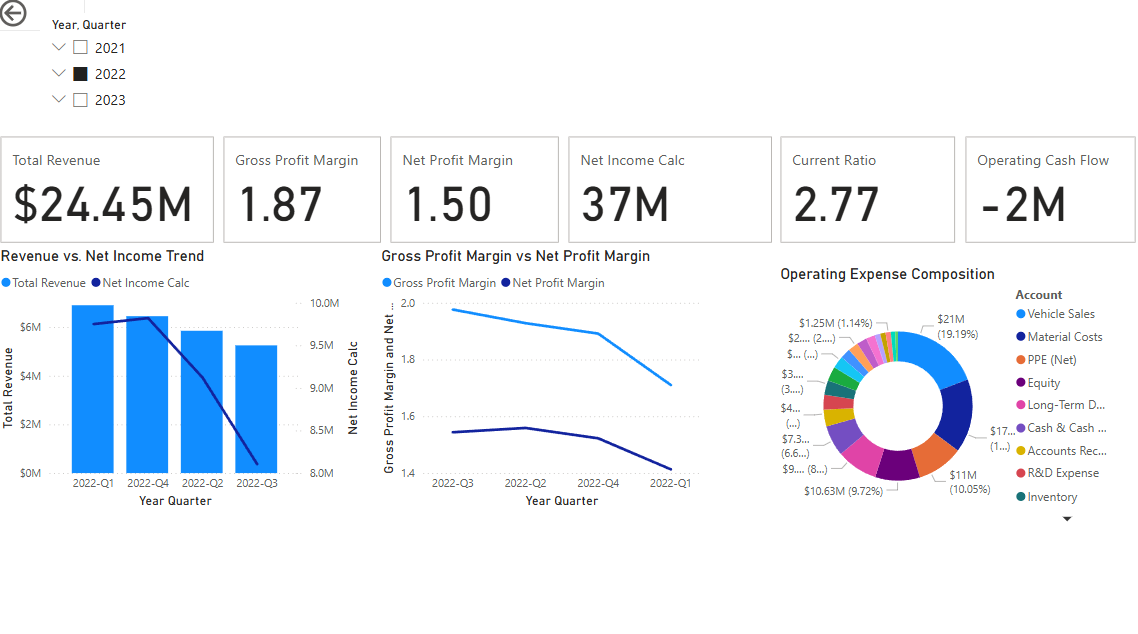
Executive Summary
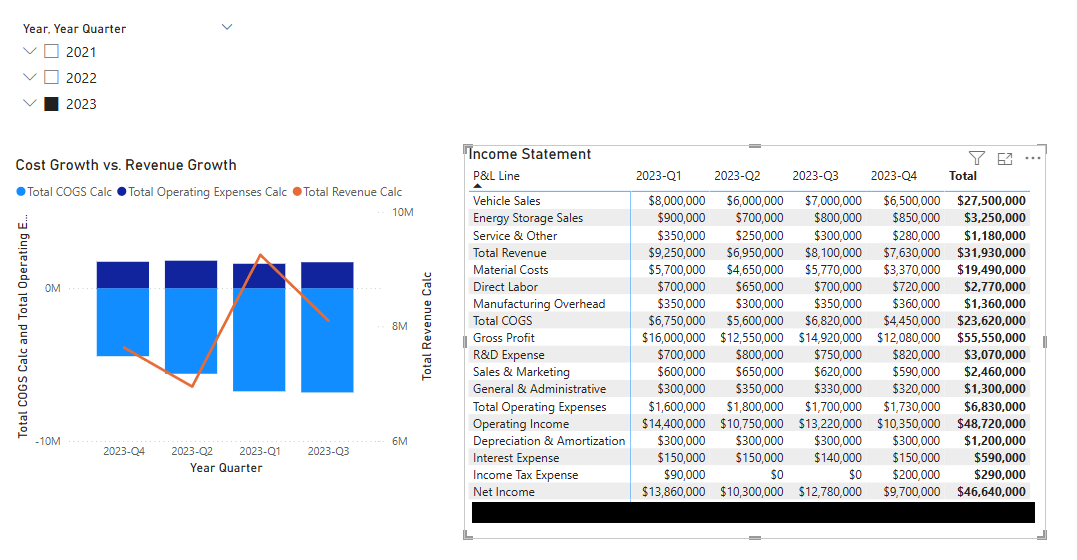
Profit & Loss (P&L) Analysis
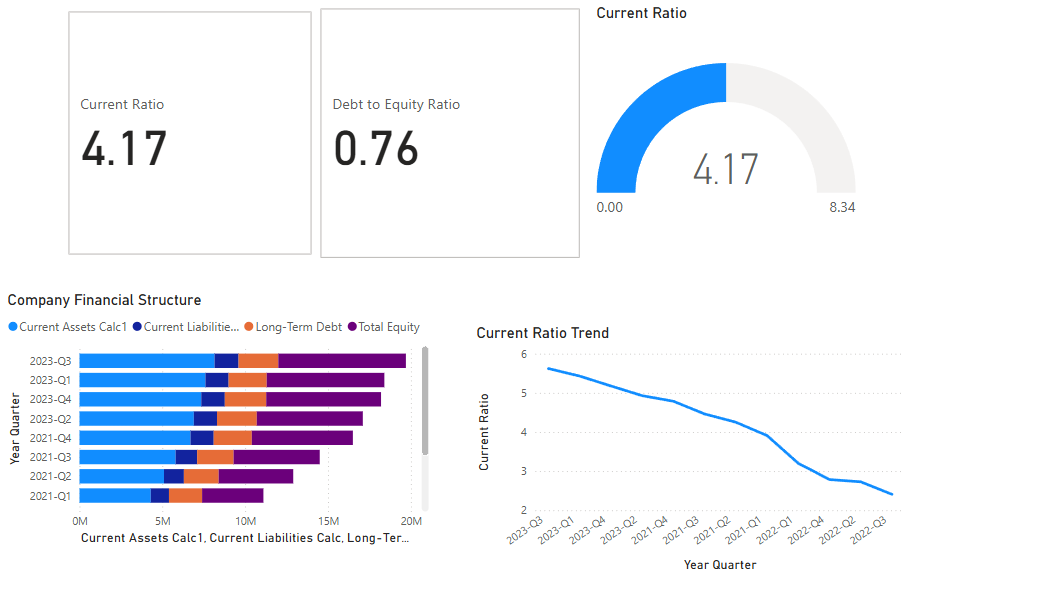
Balance Sheet & Financial Position
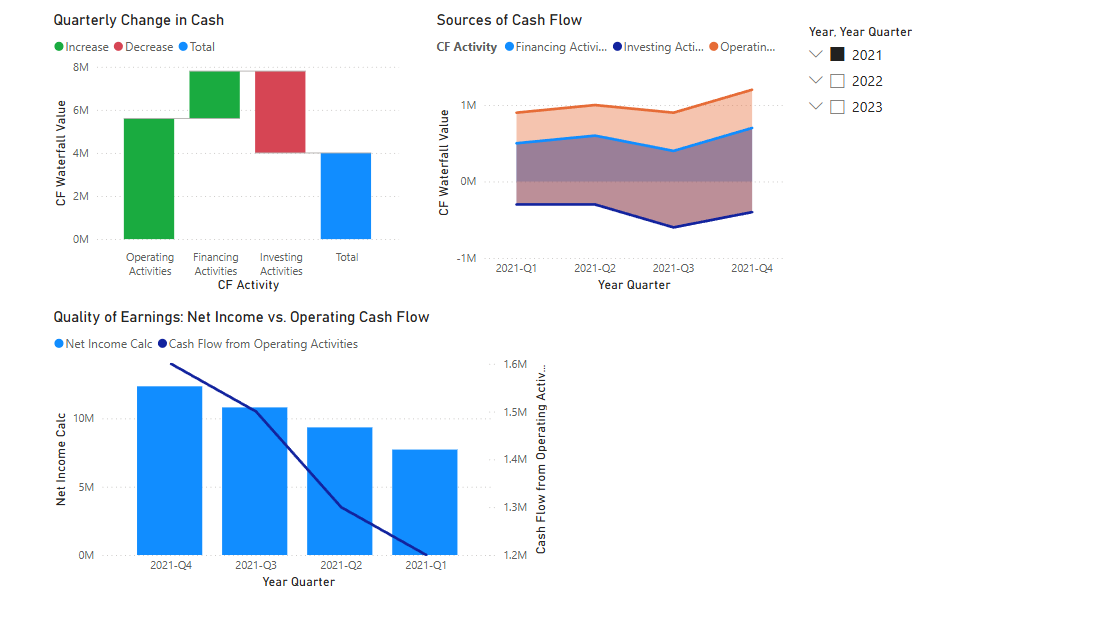
Cash Flow Analysis