Supply Chain Cost & Efficiency Analyzer
Analyzing cost drivers and modeling 'what-if' scenarios to improve operational efficiency.
Project Overview: This analysis is powered by a relational data model I constructed to simulate the end-to-end supply chain of 'SolarTech,' a mock solar panel manufacturer. The dataset includes nine interconnected tables covering everything from `Products` and `Suppliers` to `InventoryLevels` and `OutboundShipments` to provide a realistic foundation for detailed cost and efficiency analysis. The complete dataset is available for download on this page.
The Business Problem: Supply chain costs are notoriously complex and can significantly impact a company's profitability. Businesses, especially in manufacturing and retail, need clear visibility into their operational costs to identify inefficiencies and make data-driven decisions about sourcing and logistics.
My Solution: I developed a comprehensive analysis tool to tackle this problem. First, I created a mock SQL database to house data on procurement costs, supplier performance, inventory levels, and logistics. Using Python (Pandas, NumPy), I wrote scripts to analyze cost drivers, identify bottlenecks, and calculate key metrics like inventory turnover. The findings were visualized in a dynamic Power BI dashboard, which included "what-if" scenario analysis to model the financial impact of changing suppliers, shipping modes or optimizing production efficiency.
(Note: This dataset is a representative sample, anonymized to protect proprietary methods while showcasing the analytical structure.)
Key Dashboard Pages
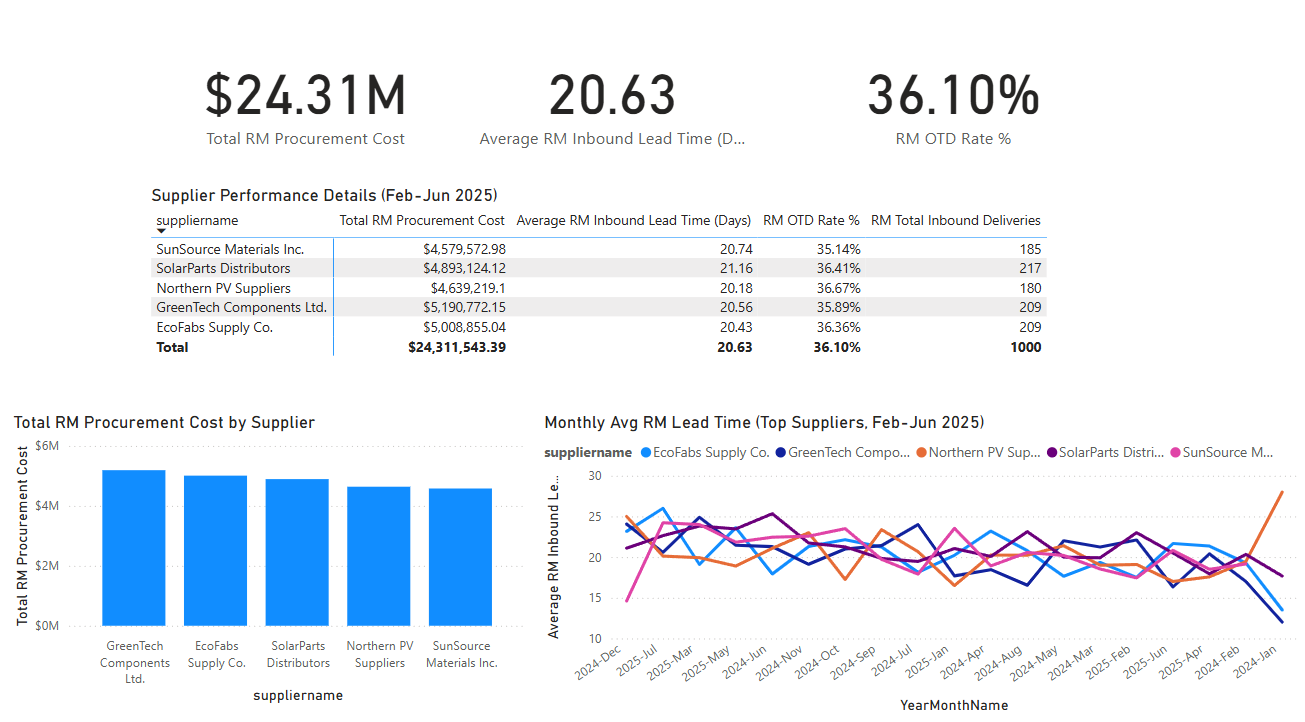
Procurement & Supplier Performance
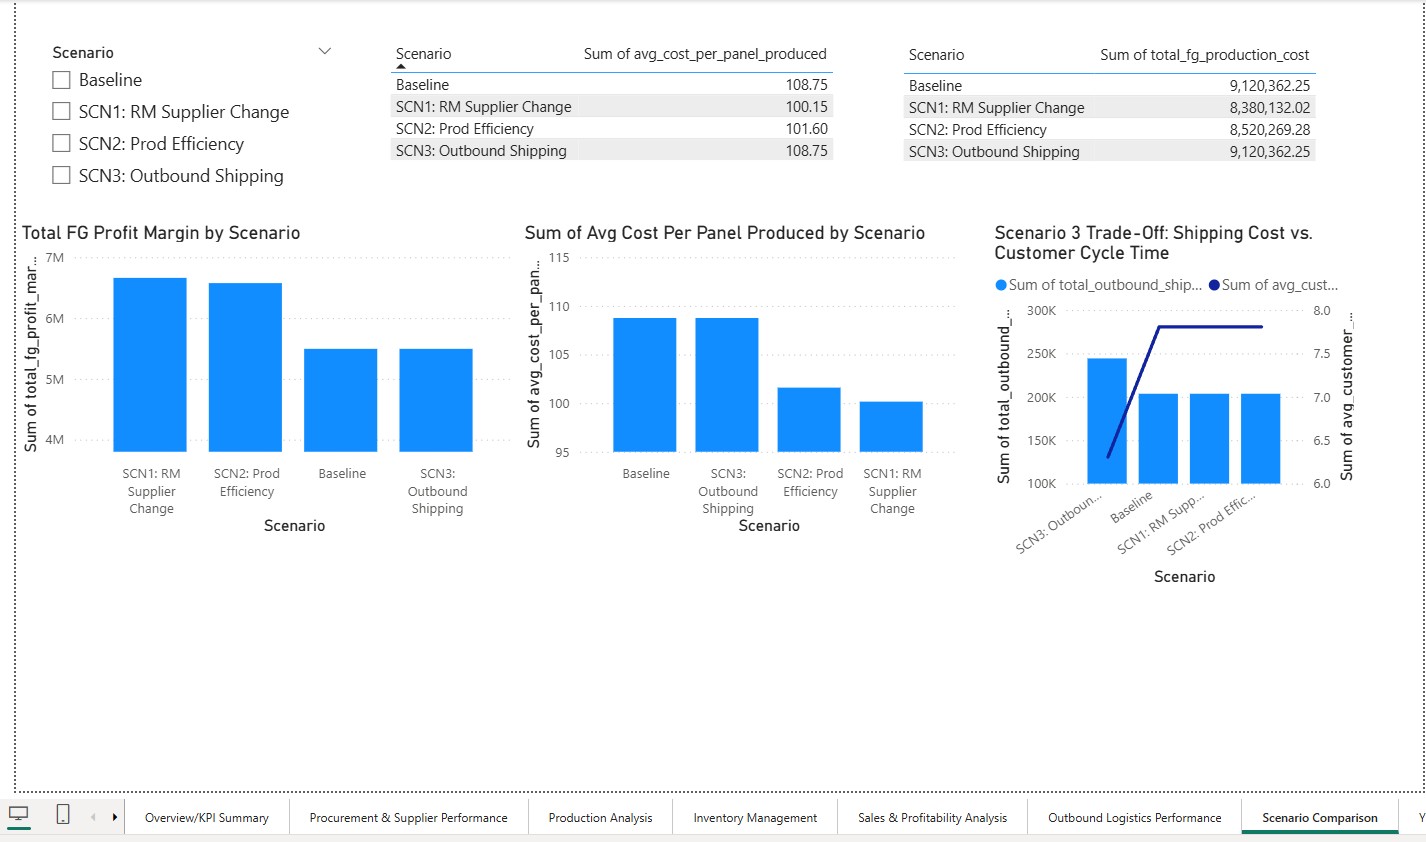
Scenario Comparison
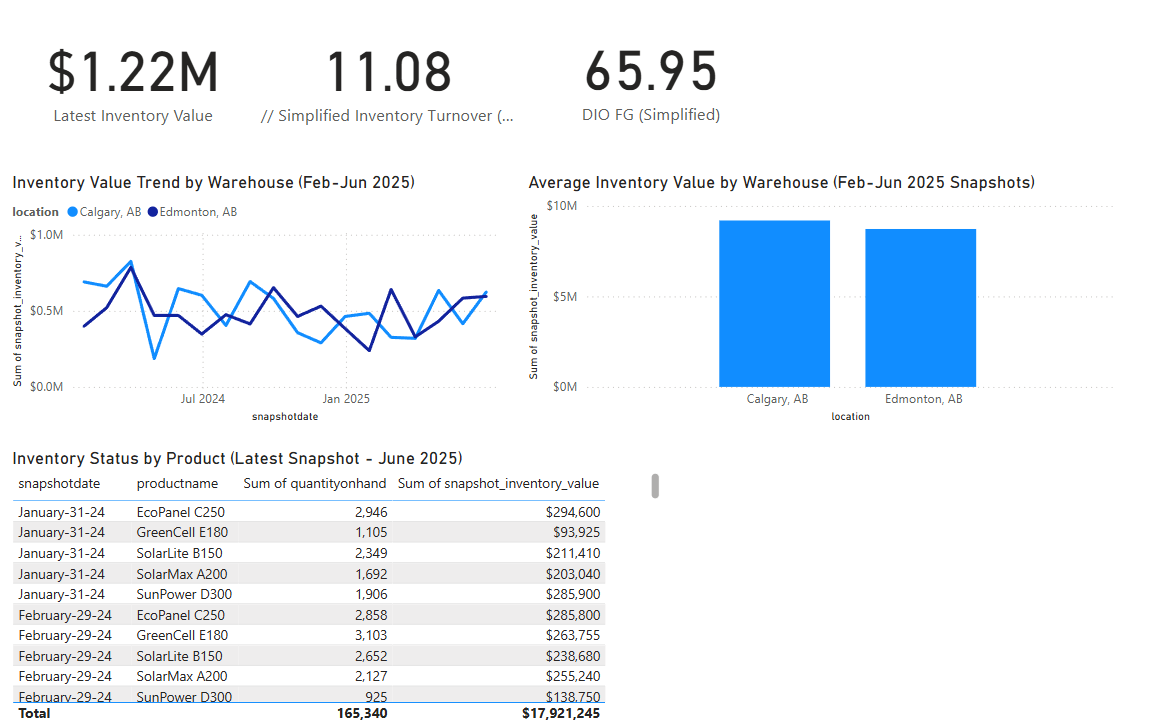
Inventory Management